# Function to calculate uniform edge weights
## Every incoming edge of v with degree dv has weight 1/dv.
uniformWeights <- function(G) {
  # Initialize empty list to store edge weights
  Ew <- list()
  # Loop over edges in the graph
  for (e in E(G)) {
    # Get the target node of the edge
    v <- ends(G, e)[2]
    # Calculate the degree of the target node
    dv <- degree(G, v, mode = "in")
    # Assign weight to the edge
    Ew[[as.character(e)]] <- 1 / dv
  }
  return(Ew)
}

# Function to calculate random edge weights
## Every edge has random weight. After weights assigned, we normalize weights of all incoming edges for each node so that they sum to 1.
randomWeights <- function(G) {
  Ew <- list()  # Initialize empty list to store edge weights
  # Assign random weights to edges
  for (v in V(G)) {
    in_edges <- incident(G, v, mode = "in")  # Get incoming edges for the current node
    ew <- runif(length(in_edges))  # Generate random weights for incoming edges
    total_weight <- sum(ew)  # Calculate the total weight of incoming edges
    # Normalize weights so that they sum to 1 for each node
    ew <- ew / total_weight
    # Store the weights for the incoming edges
    for (i in seq_along(in_edges)) {
      Ew[[as.character(in_edges[i])]] <- ew[i]
    }
  }
  return(Ew)
}


# Function to run linear threshold model
runLT <- function(G, S, Ew) {
  T <- unique(S)  # Targeted set with unique nodes
  lv <- sapply(V(G), function(u) runif(1))  # Threshold for nodes
  W <- rep(0, vcount(G))  # Weighted number of activated in-neighbors
  Sj <- unique(S)

  while (length(Sj) > 0) {
    if (length(T) >= vcount(G)) {
      break  # Break if the number of active nodes exceeds or equals the total number of nodes in G
    }
    Snew <- c()
    for (u in Sj) {
      neighbors <- neighbors(G, u, mode = "in")
      for (v in neighbors) {
        e <- as.character(get.edge.ids(G, c(v, u)))  # Define 'e' as the edge index
        if (!(v %in% T)) {
          # Calculate the total weight of the activated in-neighbors
          total_weight <- sum(Ew[[e]])

          # Update the weighted number of activated in-neighbors
          W[v] <- W[v] + total_weight

          # Check if the threshold is exceeded
          if (W[v] >= lv[v]) {
            Snew <- c(Snew, v)
            T <- c(T, v)
          }
        }
      }
    }
    Sj <- unique(Snew)  # Ensure unique nodes in the new set
  }
  return(T)  # Return all activated nodes
}


# Function to calculate the total number of active nodes at each iteration
activeNodes <- function(G, S, Ew, iterations) {
  active_df <- data.frame(iteration = integer(),
                          total_active_nodes = integer())
  total_active_nodes <- rep(0, iterations)  # Initialize empty vector to store total active nodes

  for (i in 1:iterations) {
    T <- runLT(G, S, Ew)
    message("--", i,"T:  ", T, "\n")
    total_active <- length(unique(T))  # Calculate the total active nodes in this iteration
    total_active_nodes[i] <- total_active  # Update total active nodes for current iteration

    # Limit total active nodes to the number of nodes in the graph
    if (total_active_nodes[i] >= vcount(G)) {
      total_active_nodes[i] <- vcount(G)
    }

    # Update data frame with current iteration's total active nodes
    active_df <- rbind(active_df, data.frame(iteration = i,
                                             total_active_nodes = total_active_nodes[i]))

    # Update seed set S for the next iteration
    S <- unique(c(S, T))
  }
  return(active_df)
}
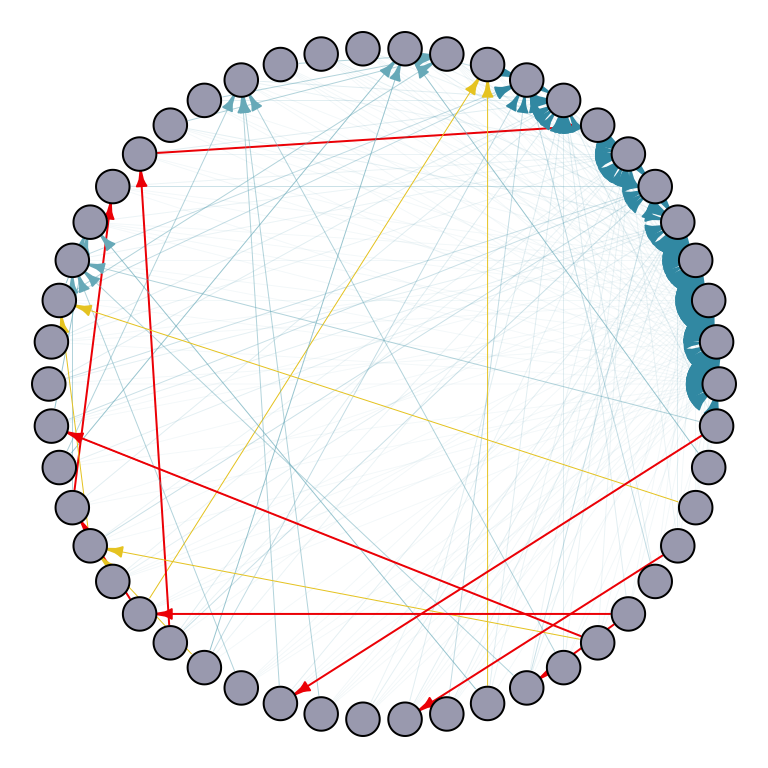
## Erdős–Rényi model
set.seed(123)
# Create a random graph with 50 nodes and edge weights satisfying the constraint
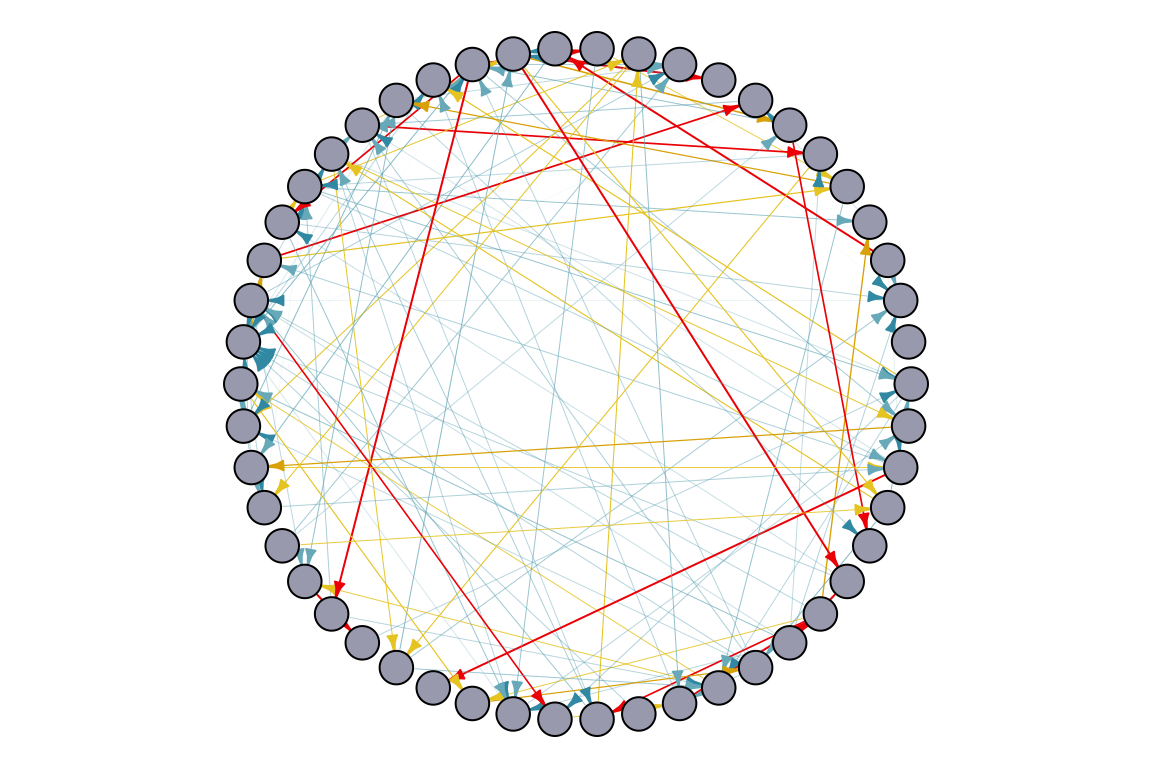
random_graph_50 <- erdos.renyi.game(50, p = 0.05, directed = TRUE) # random graph set up
# Equal edge weight for node v -> Calculate uniform edge weights
Ew_uniform <- uniformWeights(random_graph_50)
# Scale edge width based on the weights in Ew_uniform
edge_width <- sapply(E(random_graph_50), function(e) {
v <- ends(random_graph_50, e)[2]
Ew_uniform[[as.character(e)]]
})
# Map edge_width to color_palette
color_palette <- wes_palette(n=5, name="Zissou1")
edge_color <- color_palette[cut(edge_width, breaks = 5)]
# Plot the graph with gradient edge color
par(mar=c(0,0,0,0)+.1)
p1 <- plot.igraph(random_graph_50,
edge.width = edge_width,
edge.color = edge_color,
edge.arrow.size = 0.4,
layout = layout.circle,
vertex.label = NA,
vertex.size = 10,
vertex.color = "#A9AABC")
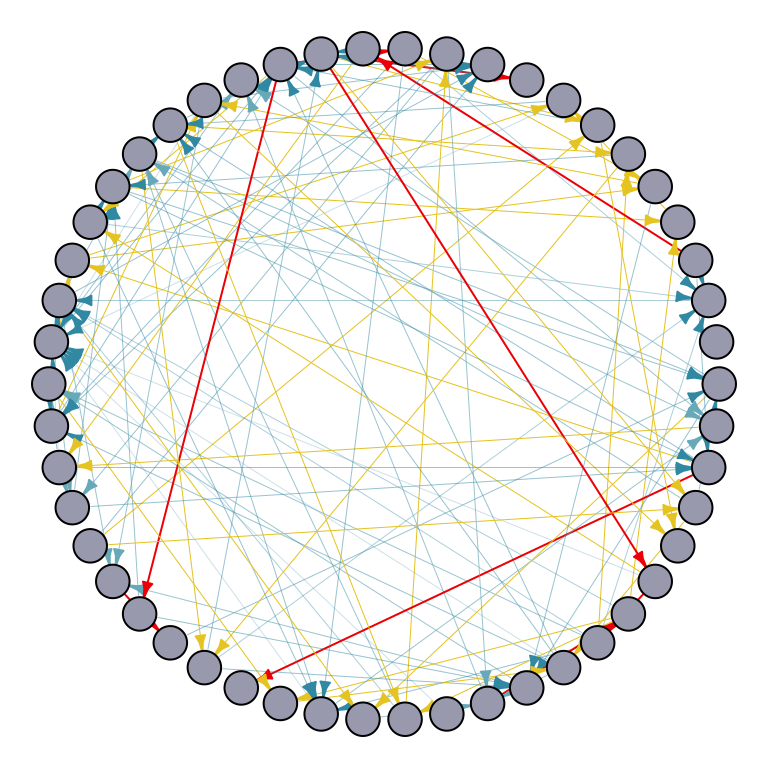
## Preferential attachment model
set.seed(123)
# Create a random graph with 50 nodes and edge weights satisfying the constraint
random_graph_50 <- sample_pa(50, power = 1, m = 5) # random graph set up

# Equal edge weight for node v -> Calculate uniform edge weights
Ew_uniform <- uniformWeights(random_graph_50)

# Scale edge width based on the weights in Ew_uniform
edge_width <- sapply(E(random_graph_50), function(e) {
  v <- ends(random_graph_50, e)[2]
  Ew_uniform[[as.character(e)]]
})

# Map edge_width to color_palette
color_palette <- wes_palette(n=5, name="Zissou1")
edge_color <- color_palette[cut(edge_width, breaks = 5)]

# Plot the graph with gradient edge color
par(mar=c(0,0,0,0)+.1)
p1 <- plot.igraph(random_graph_50,
            edge.width = edge_width,
            edge.color = edge_color,
            edge.arrow.size = 0.4,
            layout = layout.circle,
            vertex.label = NA,
            vertex.size = 10,
            vertex.color =  "#A9AABC")
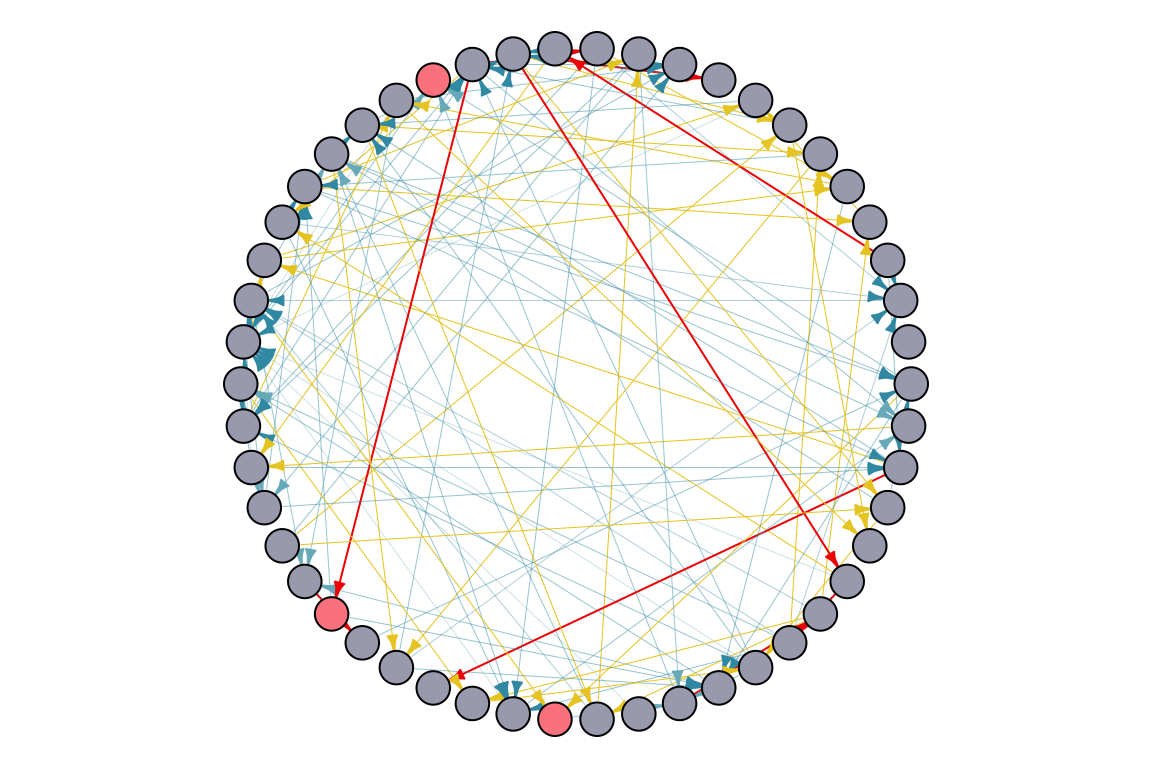
set.seed(123)
random_graph_50 <- erdos.renyi.game(50, p = 0.05, directed = TRUE) # random graph set up
## Or on preferential attachment model
# random_graph_50 <- sample_pa(50, p = 0.1, directed = TRUE) # random graph set up
S <- sample(1:vcount(random_graph_50), 3)  # Initial seed set of nodes

# Equal edge weight for node v -> Calculate uniform edge weights
Ew_uniform <- uniformWeights(random_graph_50)
head(Ew_uniform)
$`1`
[1] 0.25

$`2`
[1] 0.25

$`3`
[1] 0.25

$`4`
[1] 0.25

$`5`
[1] 0.2

$`6`
[1] 0.2
# Scale edge width based on the weights in Ew_uniform
edge_width <- sapply(E(random_graph_50), function(e) {
  v <- ends(random_graph_50, e)[2]
  Ew_uniform[[as.character(e)]]
})

# Map edge_width to color_palette
color_palette <- wes_palette(n=5, name="Zissou1")
edge_color <- color_palette[cut(edge_width, breaks = 5)]

# Plot the graph with gradient edge color
par(mar=c(0,0,0,0)+.1)
plot.igraph(random_graph_50,
            edge.width = edge_width,
            edge.color = edge_color,
            edge.arrow.size = 0.4,
            layout = layout.circle,
            vertex.label = NA,
            vertex.size = 10,
            vertex.color = ifelse(1:vcount(random_graph_50) %in% S, "#FC888F", "#A9AABC"))
# Try on 500 nodes
random_graph_500 <- erdos.renyi.game(500, p = 0.05, directed = TRUE) # random graph set up
S <- sample(1:vcount(random_graph_500), 2)  # Initial seed set of nodes

# Equal edge weight for node v -> Calculate uniform edge weights
Ew_uniform <- uniformWeights(random_graph_500)
head(Ew_uniform)
$`1`
[1] 0.04166667

$`2`
[1] 0.04166667

$`3`
[1] 0.04166667

$`4`
[1] 0.04166667

$`5`
[1] 0.04166667

$`6`
[1] 0.04166667
# Scale edge width based on the weights in Ew_uniform
edge_width <- sapply(E(random_graph_500), function(e) {
v <- ends(random_graph_500, e)[2]
Ew_uniform[[as.character(e)]]
})
## Run Linear Threshold model with uniform edge weights
# activated_nodes <- runLT(random_graph_500, S, Ew_uniform) # single iteration
# activated_nodes
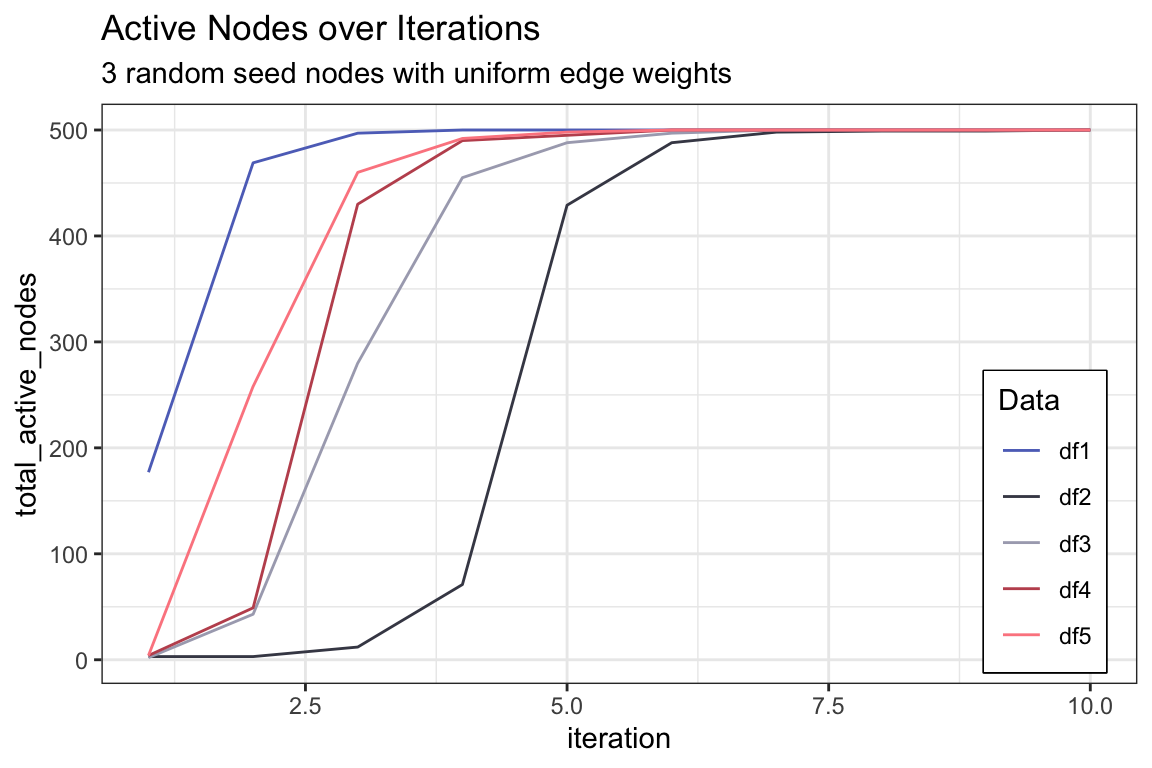
active_df1 <- activeNodes(random_graph_500, S, Ew_uniform, iterations = 10)
paged_table(active_df1)
active_df2 <- activeNodes(random_graph_500, S, Ew_uniform, iterations = 10)
active_df3 <- activeNodes(random_graph_500, S, Ew_uniform, iterations = 10)
active_df4 <- activeNodes(random_graph_500, S, Ew_uniform, iterations = 10)
active_df5 <- activeNodes(random_graph_500, S, Ew_uniform, iterations = 10)

active_df <- active_df1 %>%
  left_join(active_df2, by = "iteration") %>%
  left_join(active_df3, by = "iteration") %>%
  left_join(active_df4, by = "iteration") %>%
  left_join(active_df5, by = "iteration") %>%
  rename(df1 = total_active_nodes.x,
         df2 = total_active_nodes.y,
         df3 = total_active_nodes.x.x,
         df4 = total_active_nodes.y.y,
         df5 = total_active_nodes)

active_df %>%
  ggplot() +
  geom_line(aes(x = iteration, y = df1, color = "df1"), linetype = "solid") +
  geom_line(aes(x = iteration, y = df2, color = "df2"), linetype = "solid") +
  geom_line(aes(x = iteration, y = df3, color = "df3"), linetype = "solid") +
  geom_line(aes(x = iteration, y = df4, color = "df4"), linetype = "solid") +
  geom_line(aes(x = iteration, y = df5, color = "df5"), linetype = "solid") +
  scale_color_manual(values = c("#5E71C2", "#454655", "#A9AABC", "#C0535D", "#FC888F")) +
  ylab("total_active_nodes") +
  labs(color = "Data",
       title = "Active Nodes over Iterations",
       subtitle = "3 random seed nodes with uniform edge weights") +
  theme(legend.position = c(0.97, 0.02),
        legend.justification = c(1, 0),
        legend.box.background = element_rect(color = "black", linewidth = 0.5),
        legend.box.just = "top")
set.seed(123)
# random_graph_50 <- erdos.renyi.game(50, p = 0.05, directed = TRUE) # random graph set up
# S <- sample(1:vcount(random_graph_50), 3)  # Initial seed set of nodes

## Calculate random edge weights -> Random edge weights, then normalized to sum <= 1
Ew_random <- randomWeights(random_graph_50)
head(Ew_random)
$`1`
[1] 0.1214495

$`2`
[1] 0.3329164

$`3`
[1] 0.1727188

$`4`
[1] 0.3729152

$`5`
[1] 0.3179421

$`6`
[1] 0.0154012
# Scale edge width based on the weights in Ew_random
edge_width_random <- sapply(E(random_graph_50), function(e) {
  v <- ends(random_graph_50, e)[2]
  Ew_random[[as.character(e)]]
})

# Map edge_width to color_palette
color_palette <- wes_palette(n=5, name="Zissou1")
edge_color <- color_palette[cut(edge_width_random, breaks = 5)]

# Plot the graph with gradient edge color
par(mar=c(0,0,0,0)+.1)
plot.igraph(random_graph_50,
            edge.width = edge_width_random,
            edge.color = edge_color,
            edge.arrow.size = 0.4,
            layout = layout.circle,
            vertex.label = NA,
            vertex.size = 10,
            vertex.color = ifelse(1:vcount(random_graph_50) %in% S, "#FC888F", "#A9AABC"))
# Try on 500 nodes
# random_graph_500 <- erdos.renyi.game(500, p = 0.05, directed = TRUE) # random graph set up
# S <- sample(1:vcount(random_graph_500), 3)  # Initial seed set of nodes

# Equal edge weight for node v -> Calculate uniform edge weights
Ew_random <- randomWeights(random_graph_500)
head(Ew_random)
$`1`
[1] 0.0254803

$`2`
[1] 0.01819753

$`3`
[1] 0.03059497

$`4`
[1] 0.0814968

$`5`
[1] 0.01276849

$`6`
[1] 0.007538763
# Run Linear Threshold model with uniform edge weights
# activated_nodes <- runLT(random_graph_500, S, Ew_random) # single iteration
# activated_nodes
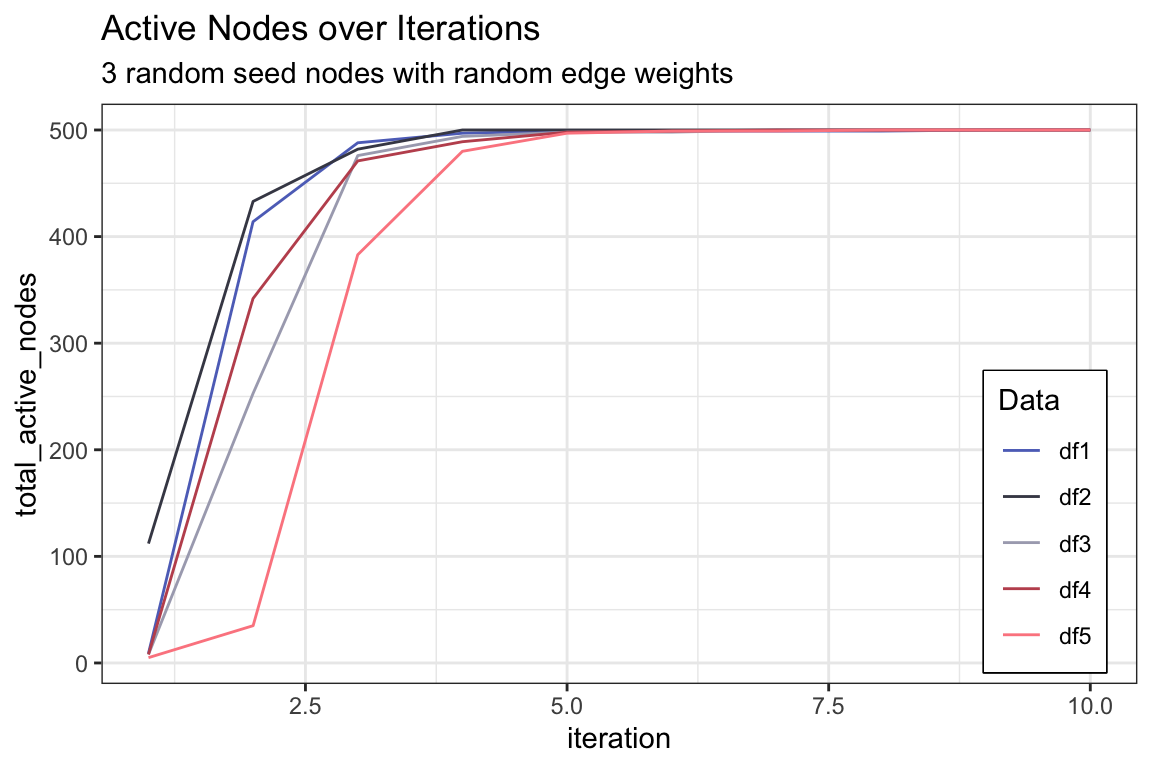
active_df1 <- activeNodes(random_graph_500, S, Ew_random, iterations = 10)
active_df2 <- activeNodes(random_graph_500, S, Ew_random, iterations = 10)
active_df3 <- activeNodes(random_graph_500, S, Ew_random, iterations = 10)
active_df4 <- activeNodes(random_graph_500, S, Ew_random, iterations = 10)
active_df5 <- activeNodes(random_graph_500, S, Ew_random, iterations = 10)
active_df <- active_df1 %>%
left_join(active_df2, by = "iteration") %>%
left_join(active_df3, by = "iteration") %>%
left_join(active_df4, by = "iteration") %>%
left_join(active_df5, by = "iteration") %>%
rename(df1 = total_active_nodes.x,
df2 = total_active_nodes.y,
df3 = total_active_nodes.x.x,
df4 = total_active_nodes.y.y,
df5 = total_active_nodes)
paged_table(head(active_df))
active_df %>%
  ggplot() +
  geom_line(aes(x = iteration, y = df1, color = "df1"), linetype = "solid") +
  geom_line(aes(x = iteration, y = df2, color = "df2"), linetype = "solid") +
  geom_line(aes(x = iteration, y = df3, color = "df3"), linetype = "solid") +
  geom_line(aes(x = iteration, y = df4, color = "df4"), linetype = "solid") +
  geom_line(aes(x = iteration, y = df5, color = "df5"), linetype = "solid") +
  scale_color_manual(values = c("#5E71C2", "#454655", "#A9AABC", "#C0535D", "#FC888F")) +
  ylab("total_active_nodes") +
  labs(color = "Data",
       title = "Active Nodes over Iterations",
       subtitle = "3 random seed nodes with random edge weights") +
  theme(legend.position = c(0.97, 0.02),
        legend.justification = c(1, 0),
        legend.box.background = element_rect(color = "black", linewidth = 0.5),
        legend.box.just = "top")
# Function to calculate average size of activated nodes
avgLT <- function(G, S, Ew, iterations=1) {
  avgSize <- 0
  for (i in 1:iterations) {
    T <- runLT(G, S, Ew)
    avgSize <- avgSize + length(T) / iterations
  }
  return(avgSize)
}


# Define the Greedy_LTM function
Greedy_LTM <- function(G, Ew, k, iterations) {
  start <- Sys.time()  # Record the start time
  S <- c()  # Initialize the seed set

  for (i in 1:k) {
    inf <- data.frame(nodes = V(G), influence = NA)  # Initialize the influence table

    # Calculate the influence for nodes not in S
    for (v in V(G)) {
      if (!(v %in% S)) {
        inf$influence[v] <- avgLT(G, c(S, v), Ew, iterations = 1)
      }
    }

    # Exclude nodes already in S
    inf_excluded <- inf[!inf$nodes %in% S, ]

    # Select the node with maximum influence and add it to the seed set
    u <- inf_excluded[which.max(inf_excluded$influence), ]$nodes
    cat("Selected node:", u, "with influence:", max(inf_excluded$influence), "\n")

    # Convert node name to numeric
    u <- as.numeric(u)

    # Add selected node to the seed set
    S <- c(S, u)
  }

  end <- Sys.time()  # Record the end time
  # Print the total time taken
  print(paste("Total time:", end - start))

  return(S)  # Return the seed set
}
# Adapt function to store the total number of active nodes at each iteration in list
activeNodes_list <- function(G, S, Ew, iterations) {
  active_df <- data.frame(iteration = integer(),
                          total_active_nodes = integer())
  total_active_nodes <- rep(0, iterations)  # Initialize empty vector to store total active nodes
  T_list <- list()  # Initialize list to store T values

  for (i in 1:iterations) {
    T <- runLT(G, S, Ew)
    # cat("--", i,"T:  ", T, "\n")
    total_active <- length(unique(T))  # Calculate the total active nodes in this iteration
    total_active_nodes[i] <- total_active  # Update total active nodes for current iteration

    # Limit total active nodes to the number of nodes in the graph
    if (total_active_nodes[i] >= vcount(G)) {
      total_active_nodes[i] <- vcount(G)
    }

    # Update data frame with current iteration's total active nodes
    active_df <- rbind(active_df, data.frame(iteration = i,
                                             total_active_nodes = total_active_nodes[i]))

    # Store T values in the list
    T_list[[i]] <- T

    # Update seed set S for the next iteration
    S <- unique(c(S, T))
  }

  return(list(active_df = active_df, T_list = T_list))
}


# Example usage
random_graph <- erdos.renyi.game(50, 0.1, directed = TRUE)
# Calculate uniform edge weights
Ew_uniform <- uniformWeights(random_graph)

# Run the Greedy_LTM function
seed_set <- Greedy_LTM(random_graph, Ew_uniform, k = 3, iterations = 5)
Selected node: 15 with influence: 39
Selected node: 11 with influence: 39
Selected node: 22 with influence: 44
[1] "Total time: 0.14822506904602"
active_df_selectedSeed <- activeNodes_list(random_graph, seed_set, Ew_uniform, iterations = 5)

# Scale edge width based on the weights in Ew_uniform
edge_width <- sapply(E(random_graph), function(e) {
  v <- ends(random_graph, e)[2]
  Ew_uniform[[as.character(e)]]
})
# Map edge_width to color_palette
color_palette <- wes_palette(n = 5, name = "Zissou1")
edge_color <- color_palette[cut(edge_width, breaks = 5)]


# Add seed set to the beginning of T_list
T_list_with_seed <- c(list(seed_set), active_df_selectedSeed[["T_list"]])

# Create the GIF
saveGIF(
  expr = {
    for (i in seq_along(T_list_with_seed)) {
      T <- T_list_with_seed[[i]]
      par(mar=c(6,0,0,0)+.1)
      p <- plot.igraph(
        random_graph,
        edge.width = edge_width,
        edge.color = edge_color,
        edge.arrow.size = 0.4,
        layout = layout.circle,
        # vertex.label = NA,
        vertex.size = 10,
        vertex.color = ifelse(1:vcount(random_graph) %in% T, "#FC888F", "#A9AABC")
      )
      title(p, ifelse(i == 1, "Initial Seed Set", paste("In Step", i - 1)))
    }
  },
  movie.name = "LTM_animation_greedy.gif",
  clean = TRUE,
  fps = 4,  # Adjust fps value as needed
  fig.height = 4,  # Adjust figure height
  fig.width = 6  # Adjust figure width
)
[1] TRUE
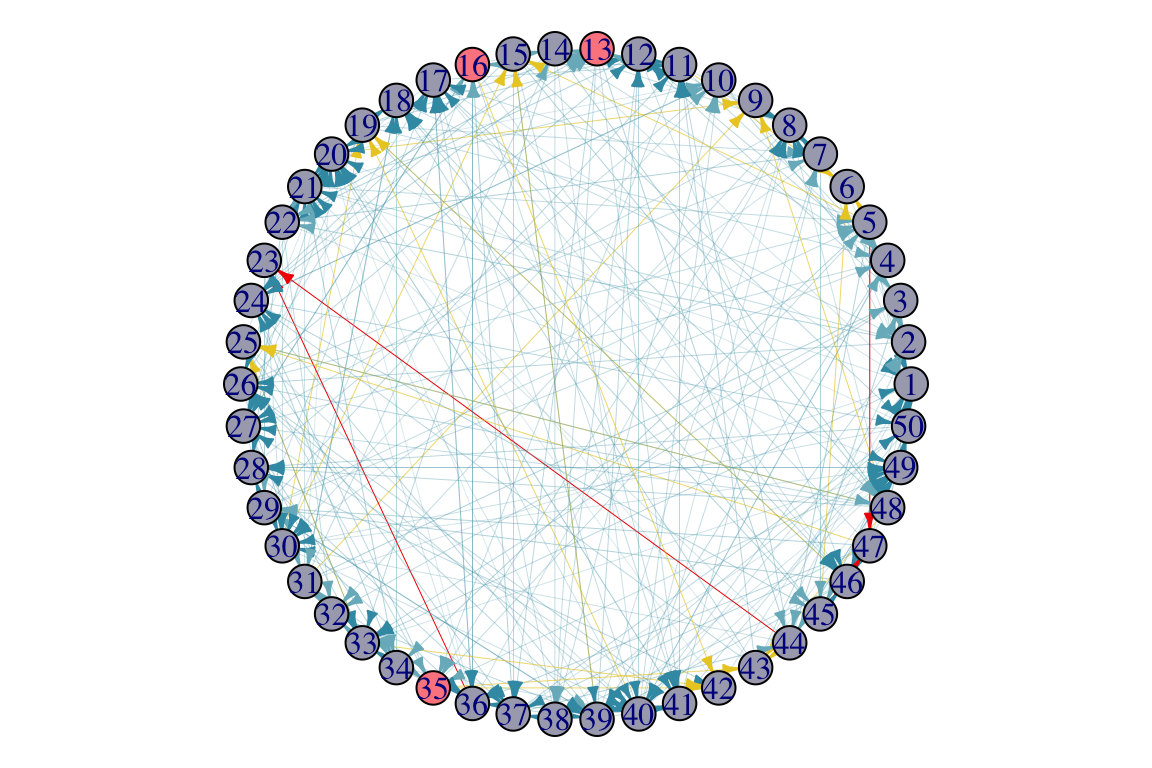
random_graph <- erdos.renyi.game(50, 0.1, directed = TRUE)
# Calculate uniform edge weights
Ew_uniform <- uniformWeights(random_graph)

# Run the Greedy_LTM function
seed_set <- Greedy_LTM(random_graph, Ew_uniform, k = 3, iterations = 10)
Selected node: 35 with influence: 40
Selected node: 16 with influence: 45
Selected node: 13 with influence: 38
[1] "Total time: 0.194589138031006"
[1] 35 16 13
# Scale edge width based on the weights in Ew_uniform
edge_width <- sapply(E(random_graph), function(e) {
  v <- ends(random_graph, e)[2]
  Ew_uniform[[as.character(e)]]
})

# Map edge_width to color_palette
color_palette <- wes_palette(n=5, name="Zissou1")
edge_color <- color_palette[cut(edge_width, breaks = 5)]

# Plot the graph with gradient edge color
par(mar=c(0,0,0,0)+.1)
p1 <- plot.igraph(random_graph,
            edge.width = edge_width,
            edge.color = edge_color,
            edge.arrow.size = 0.4,
            layout = layout.circle,
            # vertex.label = NA,
            vertex.size = 10,
            vertex.color =  ifelse(1:vcount(random_graph) %in% seed_set, "#FC888F", "#A9AABC"))
active_df_selectedSeed <- activeNodes(random_graph, seed_set, Ew_uniform, iterations = 10)
# paged_table(active_df_selectedSeed)

S1 <- sample(1:vcount(random_graph), 3)  # Initial seed set of nodes
S2 <- sample(1:vcount(random_graph), 3)  # Initial seed set of nodes
S3 <- sample(1:vcount(random_graph), 3)  # Initial seed set of nodes

active_df1 <- activeNodes(random_graph, S1, Ew_uniform, iterations = 10)
active_df2 <- activeNodes(random_graph, S2, Ew_uniform, iterations = 10)
active_df3 <- activeNodes(random_graph, S3, Ew_uniform, iterations = 10)

active_df <- active_df1 %>%
  left_join(active_df2, by = "iteration") %>%
  left_join(active_df3, by = "iteration") %>%
  left_join(active_df_selectedSeed, by = "iteration") %>%
  rename(df1 = total_active_nodes.x,
         df2 = total_active_nodes.y,
         df3 = total_active_nodes.x.x,
         greedy = total_active_nodes.y.y)

paged_table(head(active_df))
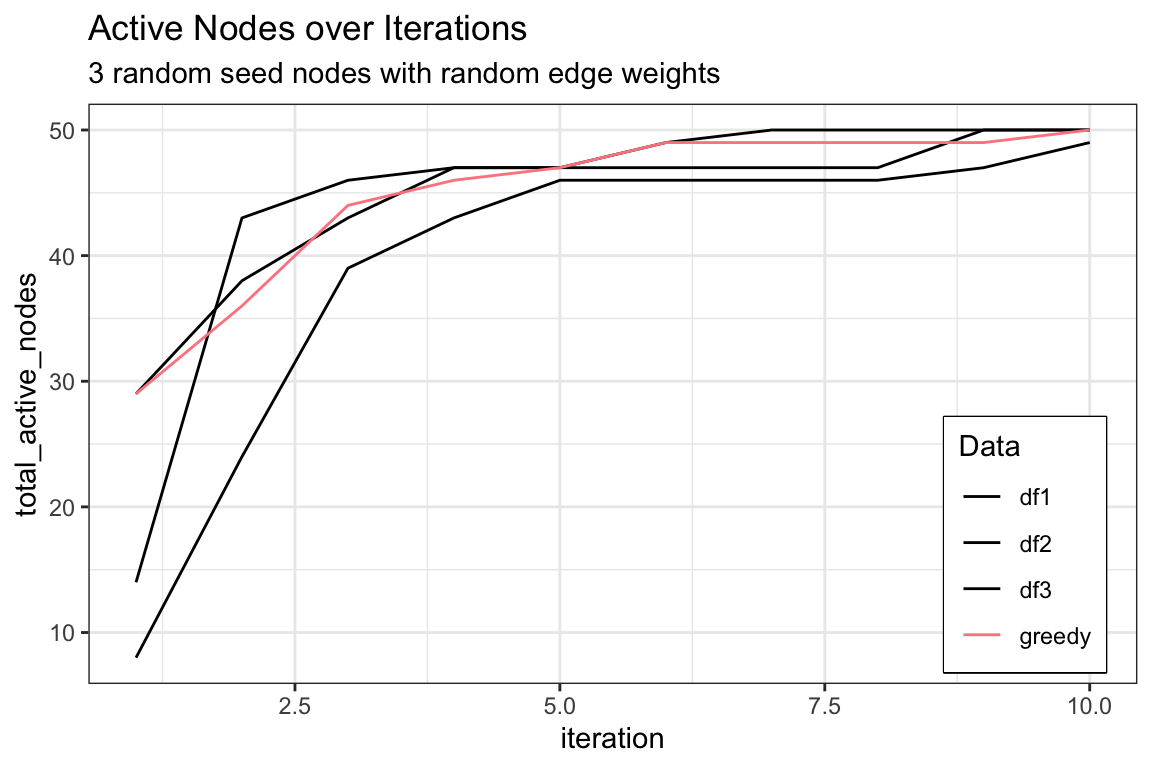
active_df %>%
  ggplot() +
  geom_line(aes(x = iteration, y = df1, color = "df1"), linetype = "solid") +
  geom_line(aes(x = iteration, y = df2, color = "df2"), linetype = "solid") +
  geom_line(aes(x = iteration, y = df3, color = "df3"), linetype = "solid") +
  geom_line(aes(x = iteration, y= greedy, color = "greedy"), linetype = "solid") +
  scale_color_manual(values = c("black", "black", "black", "#FC888F")) +
  ylab("total_active_nodes") +
  labs(color = "Data",
       title = "Active Nodes over Iterations",
       subtitle = "3 random seed nodes with random edge weights") +
  theme(legend.position = c(0.97, 0.02),
        legend.justification = c(1, 0),
        legend.box.background = element_rect(color = "black", linewidth = 0.5),
        legend.box.just = "top")